“Agreeing on Business Value”
Portia Tung and I ran the “Agreeing on Business Value” session at the Mini XP Days Benelux 2011 conference. In the workshop participants have to create a “Business Value Model” for a case we provided. The Business Value Model shows the most important goals and measures of the company and the relationships between goals. We often run this workshop to let a team come up with a common definition of “Business Value”. As a result of the workshop, everybody’s has a clear and common understanding of the value the project or product is going to deliver.
We asked the teams to add what they learned at the workshop on the posters. Here’s a gallery of the outputs of different groups. Click on the images to get a larger picture.
Team 1
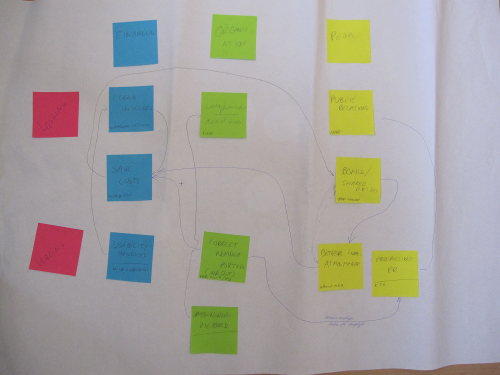
In the model different types of goals have different colors: financial goals are blue, organisation goals are green and people goals are yellow. At the top are the “lagging measures” (those that can only be measure late). At the bottom are the “leading measures” (that can be measured early) that will be used to predict the achievement of the desired lagging goals. Arrows indicate that one goal has an effect on another. You’ll see that most things are interrelated. The good news is that achieving one goal can help achieve other goals in reinforcing loops. The bad news is that you may have to achieve many subgoals to achieve your desired goals.
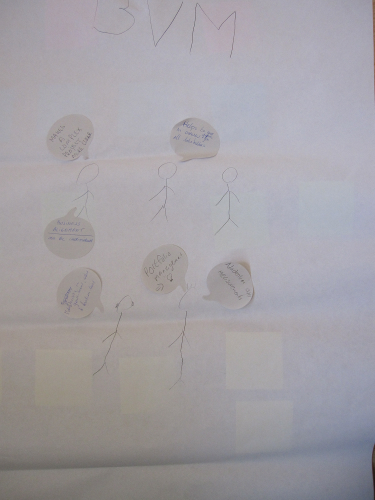
This team identified the following learnings:
- Makes a complex project more clear
- Business alignment. Today business cases are made individually
- Helps to give an overview of goals for all stakeholders
- Make decisions at goal level, not at feature level
- (You can use this for) portfolio management!
- Thinking about measures
Team 2
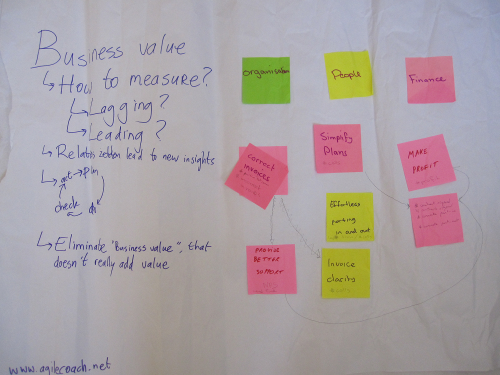
Here we se a simpler model, but still representing the financial, organisational and people goals with their relationships. Everything leads to “Make Profit” 🙂
What they learned:
- When we talk about business value, we need to think about how to measure leading and lagging indicators
- Adding the relationships generated new insights
- Plan-Do-Check-Act
- Eliminate “business value” that doesn’t really add value
Team 3
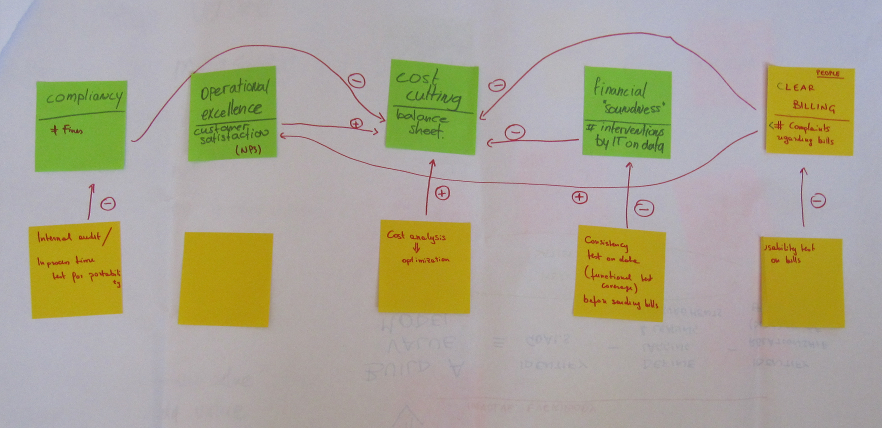
Another very clear model with positive (+) and negative (-) effects between different goals. In the end, it all results in “Cost Cutting” 🙂
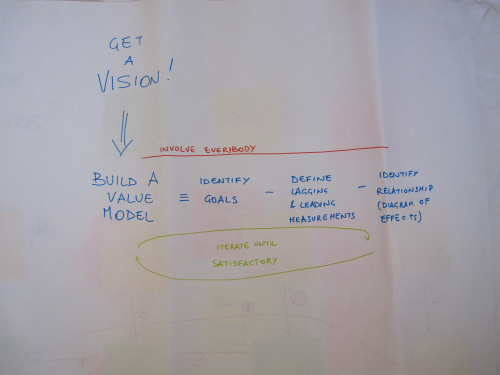
What they learned:
- It starts with a vision
- You involve everybody
- To build a model, iterate over the following steps until satisfied:
- Identify goals
- Define Lagging and Leading measurements
- Identify relationships (“Diagram of Effects”)
Team 4
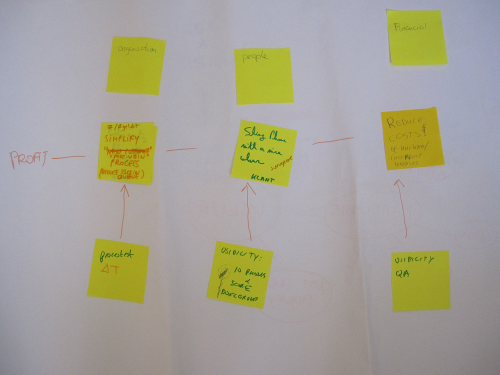
This model has exactly one leading and one lagging indicator per area. Together, the goals result in profit.
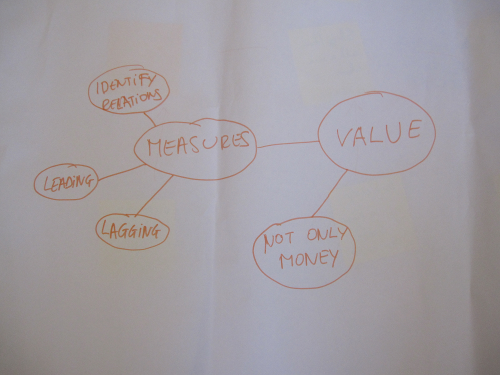
This team created a diagram of what they learned:
- Value is not just money
- Value must be measurable
- We have leading (“early”) and lagging (“late”) measures
- We need to identify the relationships between the measures
Team 5
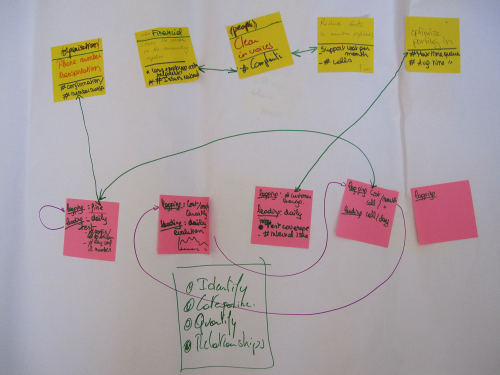
This team considered more lagging (yellow) and leading (pink) goals. Many of the goals have more than one possible measurement. If you have multiple ways to measure a goal you can choose the cheapest measure to collect or find some data that’s already being collected.
The important points for this team:
- Identify
- Categorise
- Quantify
- Relationships
What the presenters learned
- Everybody got the same case, but there are differences in the models. There is no “right model”, the team has to find one that’s useful. Over the lifetime of a product or project the business value model will probably change, as different goals change in importance
- The case is not too simple, and there’s lots of information, just like a real project. Despite that complexity teams of six “strangers” came to a clear agreement on the goals of a project within 90 minutes. How long does it take in your project to come to agreement on goals and priorities. If your projects are like mine, probably the whole duration of the project 🙂
- Making our definition of business value clear, finding ways to measure and thinking about effects and relationships helps to come up with new insights
- Participants don’t ask many questions. We were available the whole time to answer questions about the technique or the case, but despite having real live “customers” in the room, participants concentrated on the written materials
- We started by describing and drawing the company vision on the whiteboard. Most teams quickly lost sight of the vision. Once they “rediscovered” the vision, they found that it answered some questions about value and priority. It would be good to remind people of the vision before every turn. Maybe we could do this in our work too? Why not start each project meeting with a reminder of the vision?
If you want to know more, head on over to the agilecoach.net site where you’ll find more about Business Value Modeling and some other useful tools.
If you applied any of these techniques, let us know how it went.

