You’ve got stories. Each story has a cost and value. You”re working on the release.
How do you know if you’re on track? How do you let everyone know where you are?
You use a Burn up/down chart.

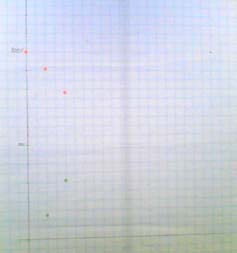
This chart shows the state of the release I’m currently working on. This chart hangs on the wall where everyone can see it, as an “information radiator”. People from other teams wander over and come look at it (*).
This release will take 10 weeks, we just finished our second week. Each week we add another red and green sticker (we should use bigger stickers):
- red = % work left to do = the sum of the cost of all finished stories / the sum of the cost of all planned stories
- green = % of value implemented = the sum of the value of all finished stories / the sum of the value of all planned stories
I’ve got a very simple Excel sheet set up to calculate these percentages, but it wouldn’t be hard to do these calculations by hand.
What would a ‘healthy‘ burn up/down chart look like? I would expect
- The cost line to go down evenly, within a few % tolerance of a straight line from 100% to 0% TODO
- The value line to go up a bit more steeply than a straight line during the first half of the project; to be less steep during the second half. This is because we work on the high value stories first, as the customer planned them.
If all goes well, we end up at a bit less than 0% TODO and a bit more than 100% value at the end of the project, because we’ve done a bit more than expected, given the previous release’s velocity. If this happens, we will start the next release with a higher velocity; we will be able to take on some more work.
In our planning game we actually select two sets of stories:
- The stories, ordered by the customer, that we commit to, given our cost estimates and velocity
- Some stories that we’ll implement “if we have some time left“. If we work faster than expected or if the customer drops one of the stories from the plan (as happened the previous release), we have a small set of stories ready to be added to the release. We can re-plan quickly by holding an extra planning game.
(*) One project manager looked at the chart and asked a few questions about it. I explained this showed our team’s progress over the 10-week project. His reponse: “Yeah, you can do this sort of stuff because you do small, manageable projects. I do large, unmanageable projects. And I feel we’re not making progress“. What? With all the time spent on putting data into Microsoft Project and massaging those numbers, you don’t know how your project is doing?