May
30

Ignore the cost accountants at your peril, because they won’t ignore you

Why should I learn about cost accounting?

It may not be immediately obvious, but the way your company manages its finances, costs and budgets has a profound effect on the way projects or products are started, run and terminated. You may have been in situations where you sat back in amazement at some incomprehensible management decision and thought “what were they thinking?”

They were probably thinking about budgets and costs. You will be surprised again next time unless you learn to understand and dialogue with your CFO and cost accountants.

Fun with cost accounting

Pierre Hervouet and I have created a session that explains the basics of cost accounting (based on making and pricing cocktails) and presents three alternative views you may find useful:

  • Throughput Accounting
  • Lean Accounting
  • Beyond Budgeting

The session doesn’t certify you as an accounting master, but it provides food for thought and pointers to plenty of material you can dig into if you want to know more. The materials (currently only in French) are published on the agilecoach site.

Join the conversation

Why don’t you go see your CFO or cost accountants today? Ask them what’s keeping them up at night. You may discover that you face much the same issues and that the solutions are similar. Yes, yes, accounting and budgeting are getting more agile, more lean!

The Agile Alliance has a new “Agile Accounting Standards” program to “Engage with FASB’s Emerging Issues Task Force to promote and develop an Agile Accounting Standard that will better define and standardize internal IT development costs for organizations that use an iterative or agile software development methodology” because  “The phased gate language [of the current standard] results in significant confusion and challenges of interpreting how to map the iterative work that happens throughout an Agile project lifecycle and is becoming an increasing urgent issue.

Jun
07

Conf Agile France 2011: Les bases des méthodes Agiles et Lean

Six éléments essentiels

La deuxième présentation à la Conférence Agile France 2011 proposait six bases essentielles pour mettre en place un environnement de travail Lean ou Agile. Comme toujours il y a de bonnes nouvelles et de mauvaises nouvelles:

  • La bonne nouvelle: Lean et Agile ne sont pas de la magie, entre temps on sait pourquoi, où et comment ça marche
  • La mauvaise nouvelle: ce n’est pas compliqué, mais c’est vraiment dur de mettre en place les prérequis nécessaires.

La présentation ne donne qu’un aperçu de chaque élément. Voici des ressources pour les 3 premiers élements, qui peuvent vous aider dans vos recherches. Les 3 autres éléments seront décrit dans un billet suivant.

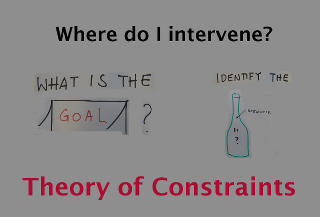
1. La Théorie des Contraintes

Originalement décrite par Eli Goldratt dans le roman “Le But”, cette théorie se résume très facilement:

  • Le résultat de chaque système est déterminé ou limité par un de ces élements, le goulot d’étranglement
  • La seule façon d’améliorer les résultats est de travailler sur le goulot.
  • Améliorer les autres élements du système n’apportera pas de bénéfices, cela aura souvent un effet négatif!

Comme mon grand-père savait déjà: “pour rendre une chaine plus forte, il faut renforcer le maillon le plus faible”.

Le “Jeu du Goulot d’étranglement” vous fait vivre les conséquences qui vont souvent contre le “bon sens”.

2. Les Real Options

Au lieu de prendre des décisions difficiles le plus tôt possible, comme nous encourage toute la littérature sur l’architecture informatique, il faut

  • attendre jusqu’au “bon” moment pour prendre chaque décision. On peut calculer exactement quand c’est le bon moment: la date de livraison – le temps d’implémentation de l’option
  • jusq’au moment de la décision on garde toutes les options ouvertes
  • on utilise le temps gagné pour rechercher plus d’informations ou pour créer d’autres options
  • on essaie de réduire le temps d’implémentation de chaque option afin de repousser vers l’arrière le moment de la decision

L’heuristique que j’utilise:

  • Une décision difficile à défaire doit être prise tard. J’essaie de réduire le temps d’implémentation pour avoir plus de temps de reflexion et évaluation.
  • Une décision facile à défaire peut être prise tôt. J’essaie de convertir des décisions difficiles à défaire en décisions faciles à défaire.

Exemples concrets:

  • Les User Stories nous donnent l’option de prendre des décisions difficiles de planning et contenu du produit plus tard que d’habitude
  • Du code clair, facile à comprendre, bien factorisé avec des tests automatiques nous permet de défaire des décisions de design et architecture à faible coût qu’on a fait auparavant pour implementer de nouveaux besoins
  • Le tableau Kanban permet à l’équipe de voir les goulots en temps réel et de réagir en conséquent.

L’article “Real Options Underlie Agile Practices” par Chris Matts (en anglais) explique les Real Options et le lien avec Agile et lean. Il y a un résumé des Real Options sur le site Agile Coach.

3. Gérer par la valeur, pas par les coûts

Au départ de nos projets on se met d’abord d’accord sur notre définition commune de “valeur”. Don Reinertsen appelle cela un “Project Economic Framework” dans The Principles of Product Development Flow: Second Generation Lean Product Development. Nous appellons cela un “Business Value Model” ou “Modèle de la Valeur Métier”.

Bien définir la Valeur avec toute l’équipe apporte beaucoup de bénéfices:

  • Toute l’équipe est alignée
  • Comme nous comprenons mieux le vrai but, il est plus facile de trouver des vraies solutions
  • Il est très facile de prioriser
  • Les projets deviennent plus petits parce qu’on élimine ce qui n’ajoute pas ou pas assez de valeur

La présentation

Apr
17

Bottlenecks around the world

Playing The Bottleneck Game

The “Bottleneck Game” is a simple game that illustrates many Agile, Lean and Theory of Constraints topics. It’s available for free with a Creative Commons license so that everybody can play it. And people do play it all over the world. For example:

Great productivity improvements for both teams! But we all know software development isn’t manufacturing, right?

Try the game. Try some of the ideas. Just like in the game, your team can create more value with less effort and a lot less stress.

Nov
01

Business Value Model Gallery

Gallery

In the Business Value Modelling session at the XP users group 6 teams created a Business Value Model for a mobile phone company struggling to keep customers and regulators happy while reducing call center costs. In the final step, each team had to create a poster that they could use to guide their decisions and to explain the reason behind the project.

As you can see from the session feedback everybody wanted to know if they had built the ‘right’ model. Let’s take a stroll through the business value model gallery and see how the teams did. Click on the images to enlarge.

Team 1
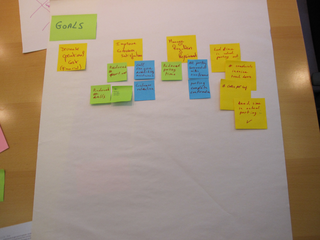
This team spent a lot of time discussing and didn’t have much time actually making the diagram. The large yellow Post-its contain the major goals. Small green Post-its are measures of the goal. Are small blue Post-its leading indicators? It’s not very clear. Only two goals seem to be worked out. There are four more large yellow Post-its to the side. What’s their meaning?

To make it perfect:

  • Add a legend to the diagram
  • Fully work out at least one goal
  • A Business Value Model doesn’t have to be “perfect”. Make something quickly and iterate.

Team 2
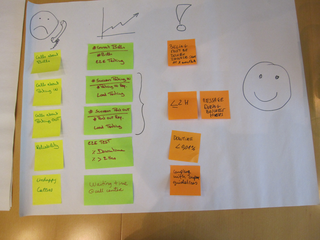
This team tells a story: we have unhappy customers and we have lots of measures that make that visible (left). We have several measures (both lagging at the top and leading at the bottom) that we can use to measure and drive improvement. Then we have several things on the right that we must comply with, either constraints or non-negotiable goals. All of this should lead to happy people (customers, employees, regulators).

To make it perfect:

  • The diagram focuses heavily on the customer. Where are the company, the regulators and the project sponsor? How could you represent their views?
  • Does the ordering of complaints have any meaning? If you could do only one thing, where would you focus?

Team 3
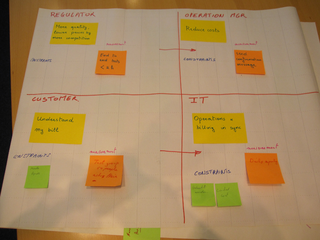
This is a very clear and near diagram with a business-like 4 quadrant format. Each of the quadrants represents the view of one stakeholder. I like the big, clear goals on the yellow Post-its. Each stakeholder has both constraints and measurements/tests.

To make it perfect:

  • Explain the meaning of the arrows. Am I correct in interpreting it as customers and regulators have goals which drive internal goals of the Operations Manager and IT?
  • The IT measurement “daily reporting” isn’t very actionable. What’s in the report?
  • The Operations manager measurement “Send confirmation” message sounds more like an action or capability than an measure or test. How can you test that confirmations have been sent? Why will that reduce costs?

Team 4
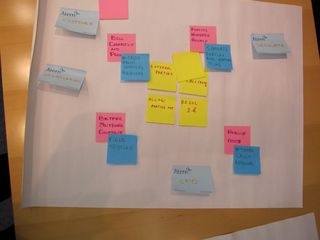
This team used a concentric circles model: on the outer circle we have the viewpoints of the stakeholders. The pink Post-Its represent a stakeholder goal; the attached blue Post-its are the measures for the goal. I’m not clear what the yellow Post-Its in the center mean. This team added a new goal that wasn’t in the original assignment: “Increase Antenna Coverage”. Apparently lots of people call in to say they can’t call 🙂

To make it perfect:

  • Show some relationships between the different items so that it clear what belongs where. For example who wants to “Bill correctly”? The customer or the organisation? Who wants to port numbers quickly? The customer or the regulator?
  • Explain the meaning of the yellow Post-its in the center
  • Instead of the “Atern” Post-its (some leftovers from the Agile Business Conference), draw the stakeholders

Team 5
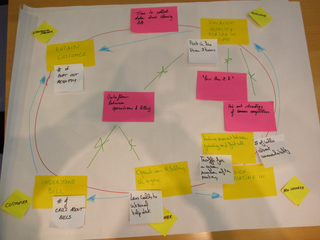
Another diagram that uses the concentric circles (or maybe a Mandala) idea. At the outside (the small yellow Post-Its) we see the stakeholders. Big bold yellow Post-its show the goals with attached measures. The Blue arrows indicate that achieving some goals helps achieve other goals. Big red Post-its indicate constraints.

To make it perfect:

  • Make the stakeholders stand out more by drawing them or having larger Post-Its. Everything we do starts with the stakeholder.
  • Add a small legend: for example what are the green lines?
  • You don’t have to reuse the Post-its. Why not just redraw the goals and measures neatly?

Team 6
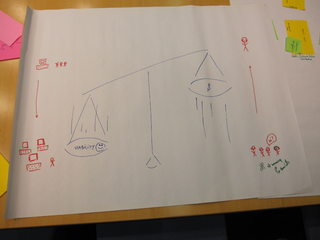
The last team had a completely drawn business value model. The central metaphor of the scales can be very powerful: by working on one side we can influence the other. Here: by increasing usability of the service, we reduce the cost of the service (or “Quality is free“). On the right, we want to reduce the number of people who call in (presumably without reducing the number of customers?). This is done, on the left, by going from a situation with few computers and lots of employees to one where computers have taken over the work. Or, as the team put it succinctly: “the solution is to replace people by computers”.

To make it perfect:

  • we have one measure for cost (“# of incoming calls” on the right). How would you measure usability on the left?
  • The image on the left (“replace employees by computers”) focuses on the ‘solution’. Can you represent how stakeholders will benefit?
  • Replacing employees by computers is (for most people) not a very rousing goal. Is this the first message you want to get across when you explain your project? How do you think those employees feel? You’ll probably have to talk to them to implement the project.

At the end of the tour

What have we learned? A Business Value Model serves several purposes:

  • To make it clear why we do the project: which stakeholder goals do we want to achieve?
  • To prioritise: which goals are more important than others?
  • To have project/product acceptance criteria: how will we know we achieved the goals?
  • To show how we will steer the project: what measures/subgoals can we use to go in the right direction?
  • To understand what is out of our control: which constraints should we abide by?
  • To create a shared model of the important aspects of value and how these aspects affect each other: what is our hypothesis of how we will generate value?

What I look for in a model is:

  • It’s clear: legible writing, a legend, appropriate use of colour and size
  • It tells a story: “we focus first on <this> and then on <that>”, “if we do <this> it’ll lead to <that>”
  • It’s motivating: the goals indicate that we’re making life and work better for people, there’s more than making money
  • It’s useful: it helps me ask the right questions like “how is this feature going to help us achieve our goals?”;  helps me to make the right decisions like  “we’ll focus on area A first, because that will help us achieve our primary goal”
  • It’s temporary: this is the best model of our system for now; as soon as we learn, we’ll update our model
  • It’s shared: the whole team contributes to making and changing the model.

When is the model “done”? Ask yourself:

  • Do I want to have this displayed prominently in the team room?
  • Do I want to use this as a decision aid?
  • Do I want to use this to explain the project to my most important customer or user; to the CFO; to the CEO; to a new team member?
  • Do I know how we can test and invalidate the model?
  • Do I want to keep this up to date?

See you at the Business Value Modelling session at XP Days Benelux. I’m looking forward to seeing the models that come out of that session.
Sep
28

Usergroup meeting 26/10/2010

XP Day session tryout: Agreeing on Business Value with Systems Thinking

Cap Gemini will host the next Agile/XP Belgium usergroup meeting. This session is a tryout for XP Days Benelux.

We talk a lot about “maximizing business value”. We ask business people and product managers to prioritise by estimating the business value of user stories. But what exactly do we mean by business value?

Over the past few years we’ve worked with many teams to define their “Business Value Model”, a clear definition of the value a project will bring to the organisation. The exercise hasn’t always been easy but it has always brought significant benefits:

  • Measurable business value in units that impact the organization (such as revenue €€€, customer satisfaction, staff retention)
  • Everybody involved was more motivated because there was a clear reason for the project and they finally understood what it was
  • The whole team was aligned around one vision because we had clear criteria to define success
  • We came up with more innovative solutions because everybody on the team, not only “the business” or “product managers/owners” could take product-related decisions based on the model
  • We could deliver a lot faster than anybody expected because the Business Value Model allowed us to easily distinguish between value-adding and non-value-adding features
  • We spent a lot less time writing and prioritising user stories because we were able to derive the user stories from the value definitions
  • The Business Value Model guided us to explore new product ideas: the business value model was a hypothesis that we could test and refine each time we released or performed user testing.

In this interactive tutorial you’ll apply some Systems Thinking techniques, such as the Diagram of Effects and Intermediate Objectives Map) to define the business value model of an example project. We’ll show you the techniques we used and discuss how you can apply those techniques in you context so that you’ll be ready to start building a business value model with your team.

Agenda:

  • 18:00 – 19:00 – Welcome with snacks and drinks
  • 19:00 – 21:00 – Session

Address: Bessenveldstraat 19, B-1831 Diegem, Belgium

Register here for this free event