Final project burn up/down chart
 I’ve posted some pictures of our project’s burn up/down chart before. Reminder:
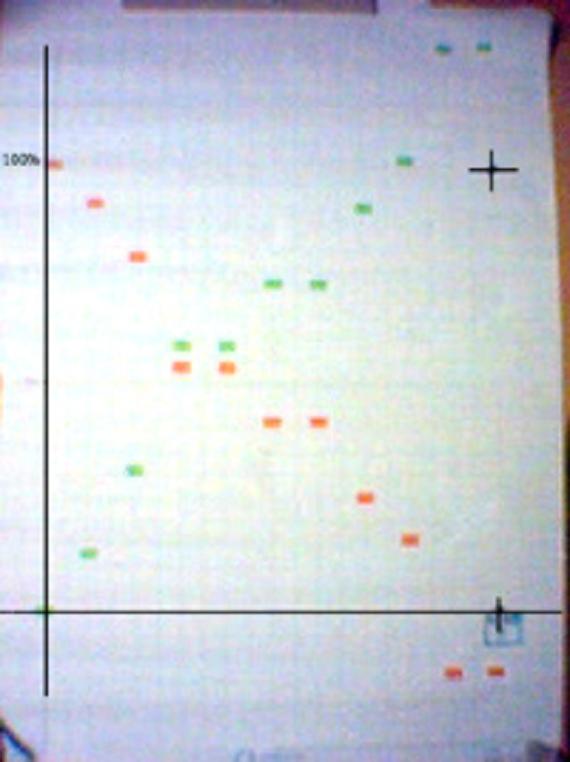
The green line represents the percentage of planned value implemented. By the end of the project we expect this to reach 100%
The red line represents the percentage of planned effort todo. By the end of the project we expect this ro reach 0%
Updates are performed every week by counting the cost and value estimates of each implemented story. The crosses indicate where we want to get.Did we get to our goal? As you can see on the picture we got a little more done than expected:
- We delivered 132% of planned value
- We performed 116% of planned effort
In normal people’s words: our users got a bit more than planned. Notice how with 16% more effort we were able to generate 32% more value. That’s because the customer (when we notified them that we could do a bit more than planned) was able to add stories that:
- had relatively low cost estimates. If they hadn’t we wouldn’t have added them late in the project.
- had relatively high value estimates. If they weren’t so valuable, the customer wouldn’t have risked adding more work and change to the project.
There are more interesting bits of information that can be gotten from this graph:
- in the middle of the project, we had two weeks with flat lines, where no stories were finished. None. This indicates that our stories were probably a bit too big.
- the work graph drops quickly near the end of the project. Several stories were waiting to be finished and they got finished just in time. This could mean we had “too much inventory” (in Lean terms): we had started too many stories at once.
- the final week or so is flat. That’s when we did formal acceptance testing, preparing to put the application in production. So, it’s normal that we don’t add more features then.
Looks good… Our velocity has gone up, again. We can promise a bit more for next release. Or can we?
This release had a lot less user involvement and testing than any recent release. Time pressure, holidays and lots of work on the user’s side took away a lot of time that could have been spent on the application.
- We can expect more problems than usual with this release. That will take some time away from new development.
- We need to spend more time with the users, to explain the release, set up more effective test sessions. That will take some time away from new development.
- The users are nearing the point where new features are implemented too fast for them, as predicted earlier. They can’t specify and test the features as quickly as they can be developed.
All of these reasons indicate that instead of going faster, the team should go slower. The bottleneck is shifting from IT to users. It’s time for IT to subordinate to the users and help them elevate the constraint, in Theory of Constraints terms.
But that’s no longer my job. This was my last release for this company. I’m off on holiday, so that I again have the time to blog and to organize and participate in the XP Day conferences all around Europe
Thanks to Nathalie, David, Nico and Thomas. It’s been fun. Keep up the good work!
Picture courtesy of Nico Mommaerts