Jun
06

Conf Agile France 2011: Résolution des Conflits

Résoudre les conflits sans compromis

La semaine passée j’ai présenté comment résoudre les conflits avec le “Diagramme de Résolution des Conflits” à la Conférence Agile Paris. La présentation est disponible ci-dessous. Plus d’informations sont disponibles sur le site Agile Coach.

A la fin de la présentation il y a deux questions pour voir si vous avez compris la leçon:

  1. Est-ce qu’il est possible de former un gouvernement belge avec cet outil? Si oui, pourquoi? Si non, pourquoi pas?
  2. Est-ce que vous pouvez résoudre ce conflit récurrent entre Product Manager et Développeurs:
    • Le Product Manager a besoin d’estimations et de planning très détaillé et fiable pour publier une roadmap qui dit quand quel fonctionnalité sera livrée quand ET livrer ces fonctionnalités comme promis
    • Les clients, qui souvent sont des grandes entreprises avec plusieures filiales dans les monde et beaucoup d’utilisateurs, ont besoin de cette roadmap pour planifier quand ils vont implémenter une nouvelle version
    • Les Développeurs sont “passés au Kanban”: ils ont arrêté de faire des estimations ou des plans. Cela prenait beaucoup de temps et ce n’était jamais correct.
    • Les Développeurs “éliminent le gachis” parce qu’ils doivent aller de plus en plus vite pour satisfaire les requêtes d’un nombre de clients qui toujours croissant.
    • Tout le monde veut livrer les fonctionnalités au client au moment où les clients attendent ces fonctionnalités.

Vos réponses et questions dans les commentaires…

D’abord essayez de clarifier le conflit.

Puis, découvrez les suppositions derrière chaque étape du raisonnement.

Translation

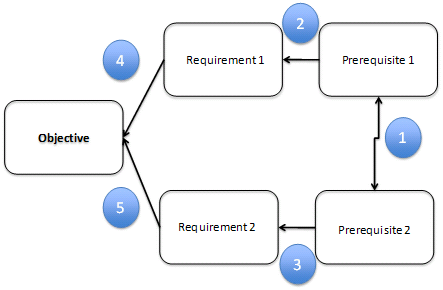
I presented an interactive tutorial on how to apply the “Conflict Resolution Diagram” at the French Agile conference in Paris. You can see the English version of the presentation at the Agile Coach site.

At the end of the French version of the presentation there are two tests to see if participants understood the tool:

  1. Can you use this tool to form a Belgian Governement. If yes, why? If not, why not?
  2. Can you resolve this common conflict between Product Manager and Developers:
    • The Product Manager needs detailed estimates and accurate planning because she has to create a long-term roadmap which spells out which features will be delivered when AND deliver those features when promised to keep customers’ trust
    • Customers, who are typically large multi-site companies with many users of the product, need the roadmap because they need to plan when they will roll out which version throughout the enterprise
    • Developers have “gone Kanban” and have stopped estimating and planning because the estimates took too much time and were incorrect anyway
    • Developers stopped estimating and planning to decrease waste so that they can keep up with the increased demand for features from the increasing user base
    • The whole company wants to deliver the features customers ask for when customers expect them.

Answers on a postcard or a comment…

First, try to clarify the conflict.

Then try to find the assumptions behind each step of the reasoning.
Apr
17

Slides for “Agreeing on Business Value” online

Agreeing on Business Value slides

Here are the slides for the “Agreeing on Business Value” session we ran at Mini XP Days Benelux 2011 and will run again at the SPA conference in June.

The exercise uses a case study that’s not published, so you can’t peek and prepare for the session 🙂

Apr
17

Bottlenecks around the world

Playing The Bottleneck Game

The “Bottleneck Game” is a simple game that illustrates many Agile, Lean and Theory of Constraints topics. It’s available for free with a Creative Commons license so that everybody can play it. And people do play it all over the world. For example:

Great productivity improvements for both teams! But we all know software development isn’t manufacturing, right?

Try the game. Try some of the ideas. Just like in the game, your team can create more value with less effort and a lot less stress.

Apr
16

Agreed on Business Value at Mini XP Day 2011

“Agreeing on Business Value”

Portia Tung and I ran the “Agreeing on Business Value” session at the Mini XP Days Benelux 2011 conference. In the workshop participants have to create a “Business Value Model” for a case we provided. The Business Value Model shows the most important goals and measures of the company and the relationships between goals. We often run this workshop to let a team come up with a common definition of “Business Value”. As a result of the workshop, everybody’s has a clear and common understanding of the value the project or product is going to deliver.

We asked the teams to add what they learned at the workshop on the posters. Here’s a gallery of the outputs of different groups. Click on the images to get a larger picture.

Team 1


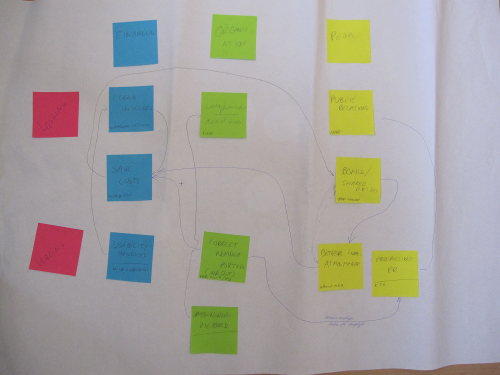
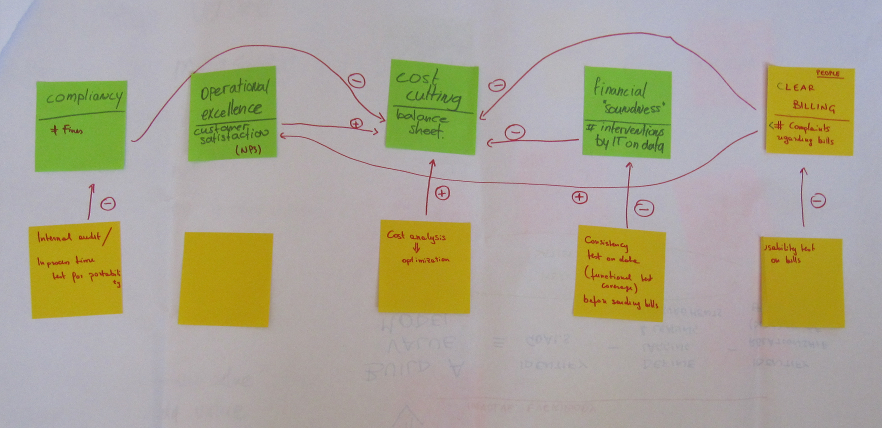
In the model different types of goals have different colors: financial goals are blue, organisation goals are green and people goals are yellow. At the top are the “lagging measures” (those that can only be measure late). At the bottom are the “leading measures” (that can be measured early) that will be used to predict the achievement of the desired lagging goals. Arrows indicate that one goal has an effect on another. You’ll see that most things are interrelated. The good news is that achieving one goal can help achieve other goals in reinforcing loops. The bad news is that you may have to achieve many subgoals to achieve your desired goals.

This team identified the following learnings:

  • Makes a complex project more clear
  • Business alignment. Today business cases are made individually
  • Helps to give an overview of goals for all stakeholders
  • Make decisions at goal level, not at feature level
  • (You can use this for) portfolio management!
  • Thinking about measures

Team 2


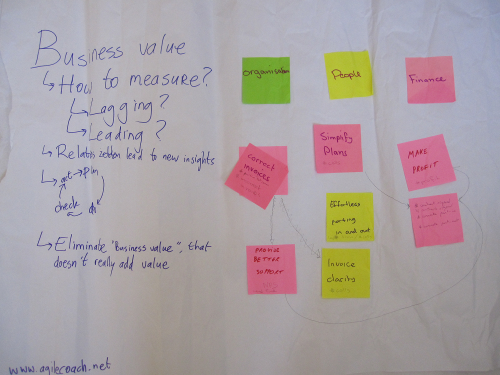
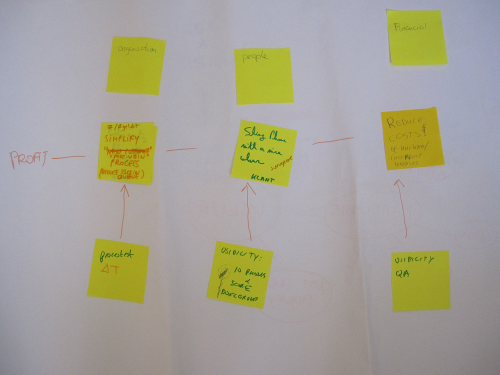
Here we se a simpler model, but still representing the financial, organisational and people goals with their relationships. Everything leads to “Make Profit” 🙂

What they learned:

  • When we talk about business value, we need to think about how to measure leading and lagging indicators
  • Adding the relationships generated new insights
  • Plan-Do-Check-Act
  • Eliminate “business value” that doesn’t really add value

Team 3


Another very clear model with positive (+) and negative (-) effects between different goals. In the end, it all results in “Cost Cutting” 🙂

What they learned:

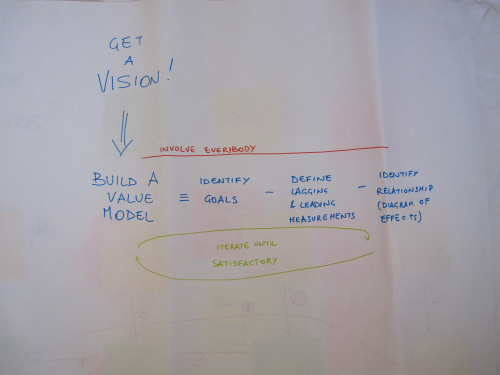
  • It starts with a vision
  • You involve everybody
  • To build a model, iterate over the following steps until satisfied:
    • Identify goals
    • Define Lagging and Leading measurements
    • Identify relationships (“Diagram of Effects”)

Team 4


This model has exactly one leading and one lagging indicator per area. Together, the goals result in profit.

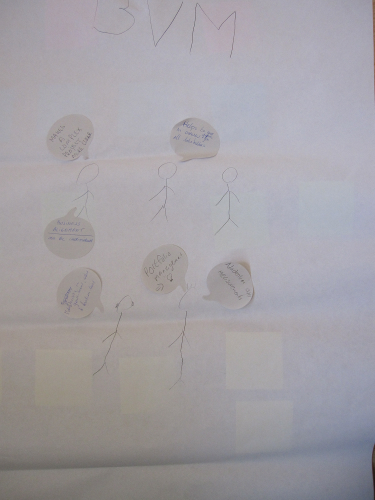
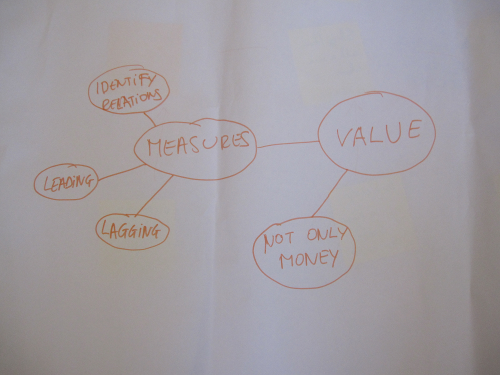
This team created a diagram of what they learned:

  • Value is not just money
  • Value must be measurable
  • We have leading (“early”) and lagging (“late”) measures
  • We need to identify the relationships between the measures

Team 5


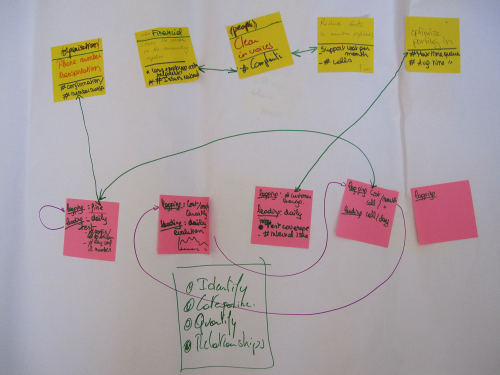
This team considered more lagging (yellow) and leading (pink) goals. Many of the goals have more than one possible measurement. If you have multiple ways to measure a goal you can choose the cheapest measure to collect or find some data that’s already being collected.

The important points for this team:

  • Identify
  • Categorise
  • Quantify
  • Relationships

What the presenters learned

  • Everybody got the same case, but there are differences in the models. There is no “right model”, the team has to find one that’s useful. Over the lifetime of a product or project the business value model will probably change, as different goals change in importance
  • The case is not too simple, and there’s lots of information, just like a real project. Despite that complexity teams of six “strangers” came to a clear agreement on the goals of a project within 90 minutes. How long does it take in your project to come to agreement on goals and priorities. If your projects are like mine, probably the whole duration of the project 🙂
  • Making our definition of business value clear, finding ways to measure and thinking about effects and relationships helps to come up with new insights
  • Participants don’t ask many questions. We were available the whole time to answer questions about the technique or the case, but despite having real live “customers” in the room, participants concentrated on the written materials
  • We started by describing and drawing the company vision on the whiteboard. Most teams quickly lost sight of the vision. Once they “rediscovered” the vision, they found that it answered some questions about value and priority. It would be good to remind people of the vision before every turn. Maybe we could do this in our work too? Why not start each project meeting with a reminder of the vision?

If you want to know more, head on over to the agilecoach.net site where you’ll find more about Business Value Modeling and some other useful tools.

If you applied any of these techniques, let us know how it went.

Apr
13

Business Value at SPA 2011

Portia Tung and I will present “Agreeing on Business Value” at the SPA 2011 conference in London, June 12th to 15th.

In this interactive tutorial you’ll be able to apply “Business Value Modelling” on a case study, to decide on the goals and definition of value for an improvement project.

Come and play with us!