|
|
The previous entry described how to estimate using points and velocity. Can’t this system be mis-used by developers?
Yes…. Developers could assign artificially high estimates to stories, thereby making it seem as if they improved their velocity. Well, developers always could do this if they made estimates. There are some forces countering this:
- Are you going to give all your stories 5 points? You aren’t allowed to assign more points: if 5 is not enough you have to break down the story into smaller stories. Don’t you think the customer is going to ask questions if each story costs 5 points?
- A customer is allowed (and expected) to question the estimates: if stories A and B seem to have the same difficulty to the customer, but the developers assign a higher cost to B, the developers had better have a good explanation. If the explanation is based on the difficulty of the feature itself, the customer can only accept it. If the explanation is based on the technicalities of implementing the stories, this might be a “smell” that the design of the code is in need of refactoring. If the developers can’t explain the difference, they should re-estimate. Stories should be estimated consistently. A customer can verify this consistency.
- Story estimates are made by the team. The whole team would have to agree to “gaming the system”. Or at least, all of the most prominent and vocal members of the team. That’s quite difficult to keep up in the open, communication-rich environment of an agile team.
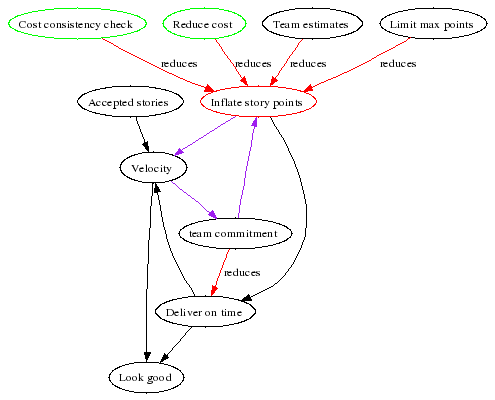
This system diagram shows how we can game the system to get a higher velocity, by working faster and more sloppily or by inflating our cost estimates. Sloppy work is kept in check by the acceptance tests the customer performs. Remember: only accepted stories count when calculating velocity.
Inflation can be kept under control by:
- The customer asking for the reasoning behind the estimates
- The customer and developers looking for lower-cost ways to get the same result
- The development team as a whole is accountable for the estimates
- Cost estimates are capped at 5
However, we still see a pernicious loop (in purple): if we inflate our estimates, we increase our velocity. If our velocity increases, the team has to commit to doing more work, which makes it unlikely to easily meet the deadline. Unless the estimates are inflated again…
We’ll see in the next entry how to break this loop.
What are story points?
Story points are an invented, team-local, measure of the innate complexity of a feature or story. How do we estimate using invented measures?
- In the first release:
- Sort the stories from easy to difficult. Create an absolute ordering by comparing each new story with those already on the table.
- Assign the easiest story 1 point. Assign the most difficult one 5 points. You may choose another range of numbers, but keep it small. This helps “level the load or “Heijunka“
- Divide the other stories into 5 groups, where the stories in each group have about the same difficulty. Give the stories in each group 1, 2, 3, 4 or 5 points.
- Done!
- In the next releases:
- Compare the new story with one or more existing stories, which have already been estimated (and preferably implemented) and seem to have the same difficulty. Give the new story the same number of points.
- Done!
The only important thing is that the stories are estimated consistently.
You still don’t know how many stories you can implement…
What’s velocity?
Velocity is another invented, team local measure of how much work the team can do. Velocity is the number of story points’ worth of stories the team can implement in one release. How do we know our team’s velocity?
- In the first release:
- We don’t know, so we’ll guess.
- Halfway the release we know a bit more: we’ll probably implement twice as many as we’ve already completed.
- In the next releases:
- We use the sum of the story points of all stories that were implemented and accepted by the customer in the previous release(s).
How many stories can you implement this release? Velocity points worth.
Why use this two step process?I feel it divides estimates into two separate factors:
- Story Points tells me the innate complexity of a feature. I don’t expect this value to change over time. If we want to get more done, we can work with the customer to look at the stories critically and see if there’s no way of simplifying the story (and thereby reducing its cost estimate), without significantly affecting the story’s value. Story points are quite imprecise and reflect that my estimates are also quite imprecise; they give none of that false sense of precision that estimations in man-hours/day give. Over a whole release, the imprecisions of the estimates mostly cancel out.
- Velocity tells if the team is speeding up or going slower if the story point estimates are consistent. If we want to get more done, we can look at various ways to improve the team’s performance. Velocity is a great way to quickly see the effects of various interventions. E.g. if we spend some time refactoring a particularly nasty piece of the code, I would expect our velocity to go up after the refactoring. If we skimp on code and test quality, I expect our velocity to go down.
Keeping the cost of stories low is a joint responsibility of customers and developers. Keeping velocity high is the responsibility of developers.
A previous entry described how to plan using cost and business value estimates. It’s really very simple:
- The customer chooses stories and the order in which to implement them, the most valuable first, the stories with the best value/cost ratio first, the stories with the most demo potential first…
- We implement the stories one by one, in the order specified by the customer
- If we don’t have enough time at the end of the release, some low-value story might not get implemented
- If we have some time left, the customer chooses another story, from the list of “if we have time” stories.
Is the real world that simple? Of course not. You have to take into account risk.
Some of the stories are riskier than others. What could the risk be ?
- The story implementation requires some new tools, a new package, a new algorithm. Anything new is always risky (or as Jerry Weinberg says “Nothing new ever works“).
- Implementation requires coordination and cooperation with another team, another division, another company. The further away, the riskier.
- The functionality affects many parts of the application.
- Your risk here
For example, in the current release there are two risky stories: one is the redefinition of an existing product, the second one is the definition of a new product. Why are these two stories risky?
- The redefinition of the first product will allow us to simplify product handling. This refactoring will touch most of the modules in the application. We will have to migrate existing data. The result has to be completely transparent and compatible with the previous release.
- The definition of the new product is a trial for a new way of structuring products. If it works out, we will (re)structure all of our products this way. If it doesn’t work…
- These products have to be defined by another team. We specify the changes, they implement them and (after a while) we get back a file containing updated product definitions.
How do we deal with this?
- Risky stories get a higher priority. We schedule these stories early in the release. The product re-definition was the first story of the release. Coordination with the product defining team started before this release, so that the new definition would be ready at the start of the release. And lucky we did it this way: due to a misunderstanding, the product re-definition was only half complete. And the person responsible for these product definitions went away on holiday. Because this risk materialized early in the release we didn’t panic, we have some time left to correct the situation.
- We have a fallback plan. Plan B.. What do we do if the worst comes to the worst and the story fails completely? In both cases, the fallback is to continue to use the current products. These products are not as effective to work with, both for IT and users, but we can get the job done.
So, the normal case is very simple: implement stories in business value order. But for some risky stories you also:
- Identify the risks, their severity and their likelyhood. Focus on those that are severe and likely
- Find ways to avoid the risk or to deal with the materialization of the risk
- Schedule the risky stories earlier in the release, so that you have the time to deal with the risk.
You’ve got stories. Each story has a cost and value. You”re working on the release.
How do you know if you’re on track? How do you let everyone know where you are?
You use a Burn up/down chart.

This chart shows the state of the release I’m currently working on. This chart hangs on the wall where everyone can see it, as an “information radiator”. People from other teams wander over and come look at it (*).
This release will take 10 weeks, we just finished our second week. Each week we add another red and green sticker (we should use bigger stickers):
- red = % work left to do = the sum of the cost of all finished stories / the sum of the cost of all planned stories
- green = % of value implemented = the sum of the value of all finished stories / the sum of the value of all planned stories
I’ve got a very simple Excel sheet set up to calculate these percentages, but it wouldn’t be hard to do these calculations by hand.
What would a ‘healthy‘ burn up/down chart look like? I would expect
- The cost line to go down evenly, within a few % tolerance of a straight line from 100% to 0% TODO
- The value line to go up a bit more steeply than a straight line during the first half of the project; to be less steep during the second half. This is because we work on the high value stories first, as the customer planned them.
If all goes well, we end up at a bit less than 0% TODO and a bit more than 100% value at the end of the project, because we’ve done a bit more than expected, given the previous release’s velocity. If this happens, we will start the next release with a higher velocity; we will be able to take on some more work.
In our planning game we actually select two sets of stories:
- The stories, ordered by the customer, that we commit to, given our cost estimates and velocity
- Some stories that we’ll implement “if we have some time left“. If we work faster than expected or if the customer drops one of the stories from the plan (as happened the previous release), we have a small set of stories ready to be added to the release. We can re-plan quickly by holding an extra planning game.
(*) One project manager looked at the chart and asked a few questions about it. I explained this showed our team’s progress over the 10-week project. His reponse: “Yeah, you can do this sort of stuff because you do small, manageable projects. I do large, unmanageable projects. And I feel we’re not making progress“. What? With all the time spent on putting data into Microsoft Project and massaging those numbers, you don’t know how your project is doing?
Theory of Constraints session at XP2005, participants were given an experiential crash course in the Theory of Constraints. They then had to apply their new knowledge to solve real world problems.
They did this in 3 groups. Each group had a “customer”, the others played “TOC consultant” to help the customer to understand and improve their system.
 |
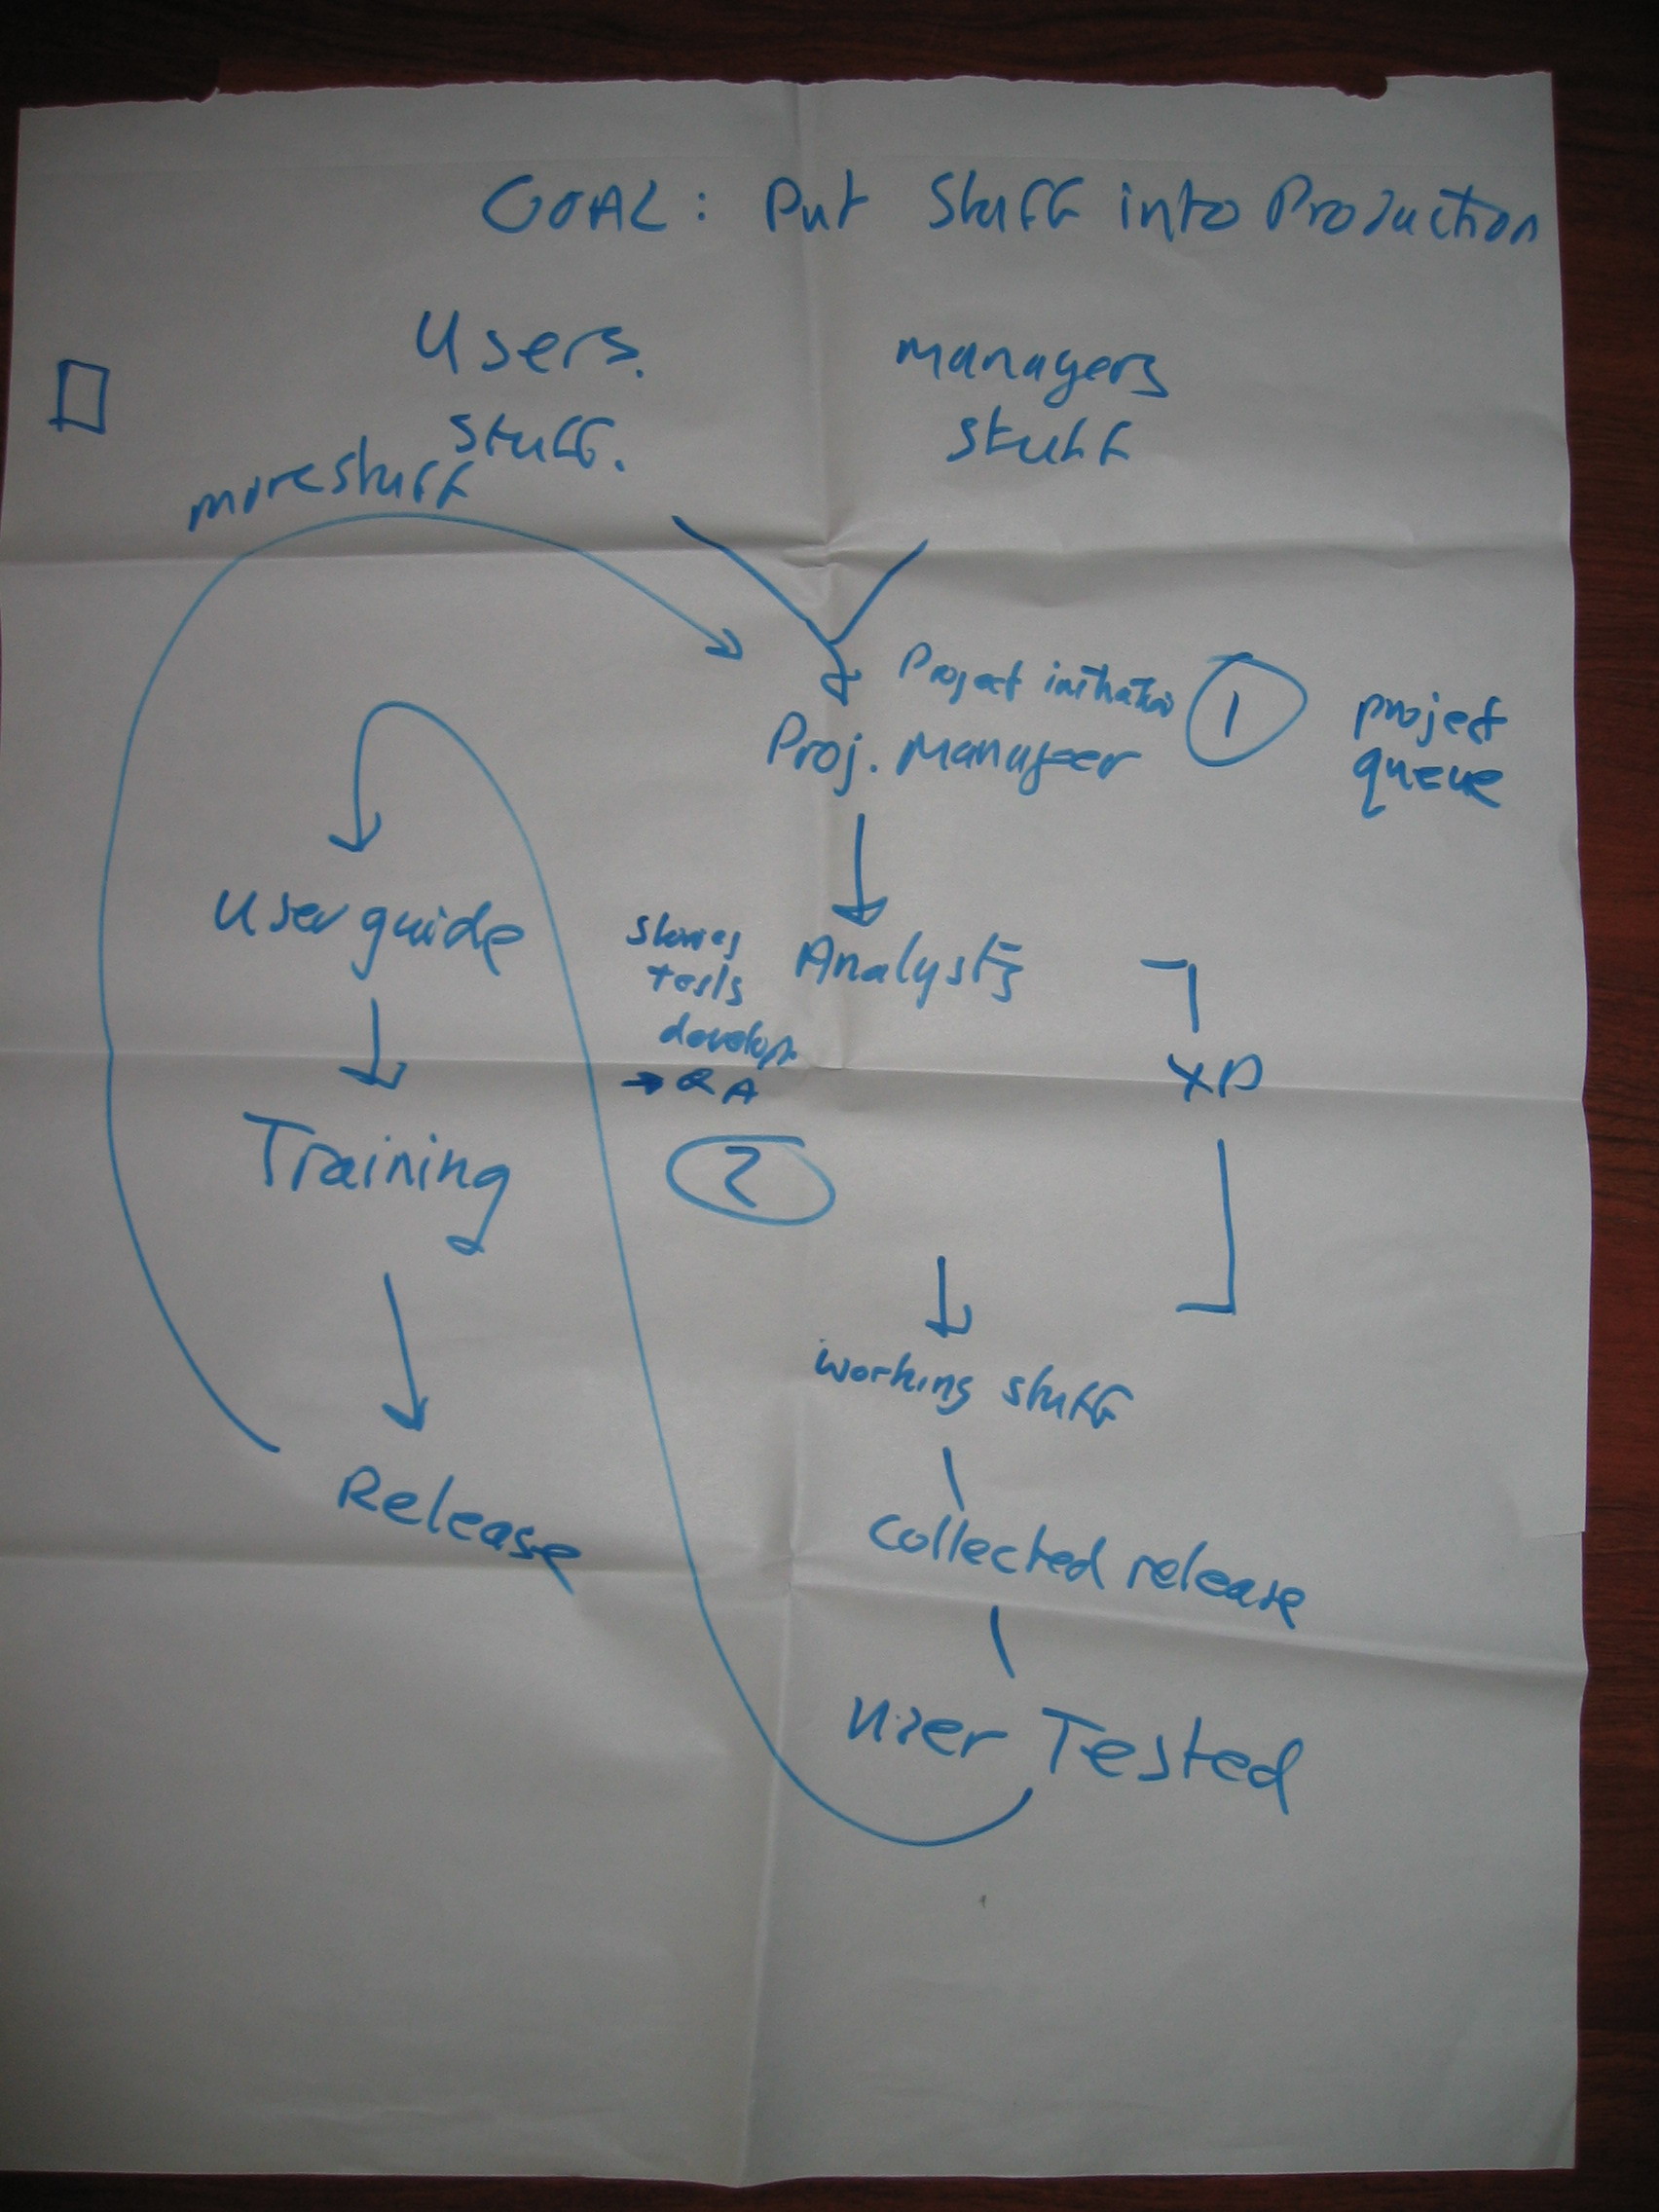
This is the output of one of the groups: it gives an overview of the whole process from requirements, over analysis, development, testing, writing manuals, training and finally putting “stuff” into production.
Click to enlarge the image
(picture courtesy of Marc Evers) |
Remarks about the poster
The goal of the system is to “Put stuff into production“. An IT system can only generate value when it’s put into production use and users are actually using it (well). Hence the User Guide and training before releasing. Part of the value in releasing a system is the feedback and ideas you receive to improve the system, hence the loop back to project initiation.
The bottleneck of this system was actually two bottlenecks (indicated as [1] and [2]), which ocurred at different times during the project. Bottleneck [1] holds the system back at the beginning of the project; bottleneck[2] holds the system back near the end of the project. It’s not as bad as a “constantly shifting constraint”, but we need to focus in different areas depending on the phase of the project.
Notice how the part marked with “XP” is between two bottlenecks. This is something that has been observed in many (if not most) XP projects: XP has very effective techniques to exploit, subordinate to and elevate a development team bottleneck. If you apply the techniques, the development team’s throughput improves a lot and it’s no longer the bottleneck. The bottleneck shifts. And who’s the bottleneck then? Usually the Customer (role) becomes the bottleneck, either in keeping the team fed with stories or in accepting the stream of finished features. Or both, as in this case.
XP in a nutshell, from a Theory of Constraints perspective:
- XP assumes that the development team is the bottleneck
- IF this is correct, XP increases the throughput of the development team and thereby shifts the bottleneck to the Customer
- If this assumption is not correct…
In the session we chose one bottleneck to concentrate on, the one the customer wanted to remove the most.
Our newly graduated “TOC consultants” suggested several ways to exploit, subordinate and elevate these bottlenecks, coming up with some novel ideas that their customer could apply to this situation. What are some of the interventions we could suggest here?
- We have two bottlenecks, before and after “XP”. They are bottlenecks at different times in the project. If they are different resources, they could help each other out: bottleneck [2] resources can help (subordinate to) bottleneck [1] resources at the beginning of the project; and vice-versa at the end of the project. E.g. testers can help analysts at the start of the project by devising acceptance tests; analysts can help testers to perform and analyze acceptance tests.
- We have a non-bottleneck resource, the “XP” team. They could subordinate to both bottlenecks, by spending some of their slack time in helping the bottlenecks. One way of doing is to assign one person from the development team to “follow the release”. This developer helps the analysts to write stories and clarify acceptance tests. They also help the testers during acceptance, the writers writing manuals, the operators installing the software. Their primary job is to smooth the interface between the development team and the world outside the team. They have a good overview of both the functional and technical content of the release. While this developer works at the end of the release, another developer starts preparing the next release and follows that release through to the end. This is a “rolling wave” planning, which is great for continuity and is a good way of “leveling the load” (One of the 14 principles of the Toyota Way). You do need people in the development team who are skilled at interfacing with other teams, who understand both the functional and technical side of a project…
|