|
|
 I’m again organizing XP Day Benelux with Vera, Marc and Rob. This year we’re back in the Netherlands, in Rotterdam. I’m again organizing XP Day Benelux with Vera, Marc and Rob. This year we’re back in the Netherlands, in Rotterdam.
It’s the third time we organize this event and it keeps getting bigger. This year is the first time we have two conference days. This brings with it some extra work (e.g. people need to stay overnight), but the growth and extra work is still manageable with the help of Marko, Willem, Nynke, Erik and Peter. We already have experience with two day events, because the Agile Open conference started out as a two day conference.
The conference will be held on November 17th and 18th, only a month from now. Still a lot of work to do, but things seem to go smoothly (for now…). I’m currently mostly working on handling the registrations, invoicing, payments. We have a little application to help us with that and I’ll tell a bit more about it later.
I’m also co-presenting two sessions at the conference:
And that’s not all… November is “conference month” for me:
 I’ll be going to the German XP Days on November 21st in Karlsruhe. My boss (me 🙂 won’t let me go to such conferences unless I present a session, so that’s what I’ll be doing. I’ll be hosting a session on The Toyota Way, similar to the session I hosted at the XP2005 conference in Sheffield this year. I’ll be going to the German XP Days on November 21st in Karlsruhe. My boss (me 🙂 won’t let me go to such conferences unless I present a session, so that’s what I’ll be doing. I’ll be hosting a session on The Toyota Way, similar to the session I hosted at the XP2005 conference in Sheffield this year.
 And I’m also going to XP Day London on November 28th and 29th. The London XP Day inspired us to do something like that ourselves. I will be hosting the I’m not a bottleneck! I’m a free man! with Rob Westgeest. And I’m also going to XP Day London on November 28th and 29th. The London XP Day inspired us to do something like that ourselves. I will be hosting the I’m not a bottleneck! I’m a free man! with Rob Westgeest.
There’s a lot of cooperation and exchange of ideas between the different XP Days. And soon we’ll have XP Day France!
See you at one of these fine events!
Final project burn up/down chart
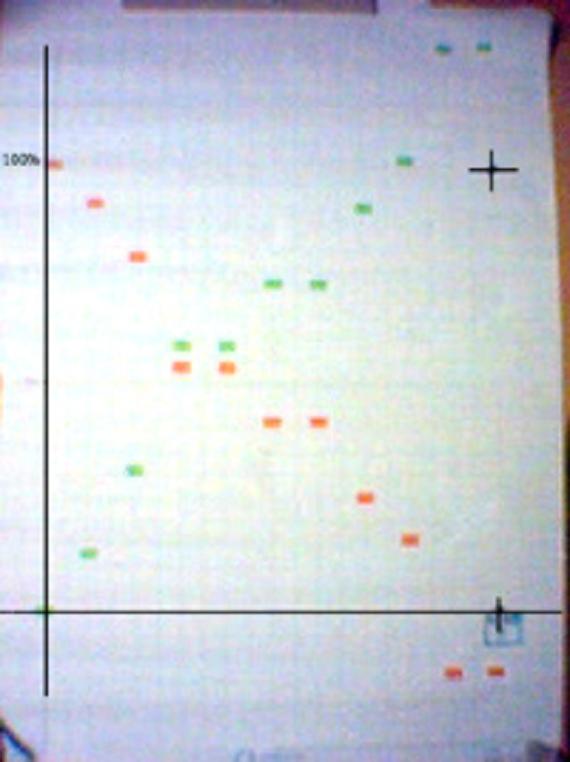
 I’ve posted some pictures of our project’s burn up/down chart before. Reminder: I’ve posted some pictures of our project’s burn up/down chart before. Reminder:
The green line represents the percentage of planned value implemented. By the end of the project we expect this to reach 100%
The red line represents the percentage of planned effort todo. By the end of the project we expect this ro reach 0%
Updates are performed every week by counting the cost and value estimates of each implemented story. The crosses indicate where we want to get.Did we get to our goal? As you can see on the picture we got a little more done than expected:
- We delivered 132% of planned value
- We performed 116% of planned effort
In normal people’s words: our users got a bit more than planned. Notice how with 16% more effort we were able to generate 32% more value. That’s because the customer (when we notified them that we could do a bit more than planned) was able to add stories that:
- had relatively low cost estimates. If they hadn’t we wouldn’t have added them late in the project.
- had relatively high value estimates. If they weren’t so valuable, the customer wouldn’t have risked adding more work and change to the project.
There are more interesting bits of information that can be gotten from this graph:
- in the middle of the project, we had two weeks with flat lines, where no stories were finished. None. This indicates that our stories were probably a bit too big.
- the work graph drops quickly near the end of the project. Several stories were waiting to be finished and they got finished just in time. This could mean we had “too much inventory” (in Lean terms): we had started too many stories at once.
- the final week or so is flat. That’s when we did formal acceptance testing, preparing to put the application in production. So, it’s normal that we don’t add more features then.
Looks good… Our velocity has gone up, again. We can promise a bit more for next release. Or can we?
This release had a lot less user involvement and testing than any recent release. Time pressure, holidays and lots of work on the user’s side took away a lot of time that could have been spent on the application.
- We can expect more problems than usual with this release. That will take some time away from new development.
- We need to spend more time with the users, to explain the release, set up more effective test sessions. That will take some time away from new development.
- The users are nearing the point where new features are implemented too fast for them, as predicted earlier. They can’t specify and test the features as quickly as they can be developed.
All of these reasons indicate that instead of going faster, the team should go slower. The bottleneck is shifting from IT to users. It’s time for IT to subordinate to the users and help them elevate the constraint, in Theory of Constraints terms.
But that’s no longer my job. This was my last release for this company. I’m off on holiday, so that I again have the time to blog and to organize and participate in the XP Day conferences all around Europe
Thanks to Nathalie, David, Nico and Thomas. It’s been fun. Keep up the good work!
Picture courtesy of Nico Mommaerts
Today was a book day
What did I find on my doorstep today? A big box full of books from Dorset House Publishing.
 |
Inexplicably, most of Gerald Weinberg‘s books are very hard to come by. He has written excellent books about Systems Thinking, the psychology of programming, congruent action, requirements, consulting… His books are required reading. So, I sent off an order directly to the publisher for myself, Laurent, Marko, Vera and Nico.The stack of books sitting now on my desk covers a lot of subjects: productivity, walkthroughs, requirements, systems thinking, measurement, psychology and organisational maturity. The two most ordered books are “The Secrets of Consulting” and “More Secrets of Consulting”.More on a few of those books later. |
 |
And on top of that box was another book: the paper copy of the Ruby on Rails book I’ve been reading in PDF pre-release form over the past month.We’ve started up development of an application to manage the registrations, payments and communications around the XP Day Benelux 2005 conference. This application uses Rails. We hope to see through the hype and learn if RoR is really so “Agile” as it claims. |
 |
And then a question about Domain Specific languages made me look up some more information about the Forth language. Forth was (a long long time ago) the first language I used that encouraged the programmer to build domain specific languages. Forth itself is a very primitive and simple language. But it allows you to create slightly higher level language elements or “words”. There is no (visible) distinction between those new words and the built-in words. And then you use those words to build slighly higher level words… Until you end up with a language that makes it easy to develop your application.So I went to look for Leo Brodie, whose books “Starting Forth” and “Thinking Forth” really made me understand this weird language and its even weirder way of programming. I wanted to buy these books for a long time, but they were out of print. And now I discover that “Thinking Forth” can be downloaded from Leo Brodie‘s site and has been re-published. I sent my order off to Amazon. Can’t wait ’till it gets here. Until then I’ve got some other books to keep me busy. |
A potential new bottleneck
Last week we noticed that some of our users didn’t know some features were available or were unsure how to use the new features in the previous release. So, we spent some time explaining some of the features.
This is a timely warning: our ability to effectively transition the software into production use could become a bottleneck. This is both a good and a bad thing:
- It means that our bottleneck, the development team, has been elevated to a level that’s nearer the capacity of the users to accept new features. This is good: our efforts to elevate the constraint are starting to work.
- Our capacity to train users and the user’s capacity to accept new features might become the new bottleneck. This is bad news: we don’t want the bottleneck to get out of our control.
This is a typical pattern for agile processes: the development team is elevated and after a while the customer, who subordinates to the development team (as the XP customer does), becomes the bottleneck. Suddenly, the customer can’t write stories fast enough to keep the team occupied; releases are implemented so quickly that the users can’t keep up with the flood of new features.
What to do?
Before the users become the new bottleneck, we need to take measures to elevate them so that the bottleneck doesn’t shift. What are we going to do?
- We have regular meetings with our key users who follow up new developments. We need to make these more “hands on”: show the users how new features work, let them experiment some more.
- Training and transition to a new release is handled by people in the users’ organisation. We can support them more during final acceptance testing and transition to the new release.
- We can hold an “end of sprint demo”, like Scrum prescribes to show the new features (and how they’re to be used) to a wider audience than the key users.
- Each release is focused on one group of users. For example, the current release contains mostly features for the commercial people. They will need some training to use the new release. Other groups will see only a few minor changes, so that for them the application doesn’t change too much.
Release less often?
Some have suggested that the problem is caused by us releasing too often. We release every two months. Should we release less often? I don’t think so: we used to release every 6 months and that caused big acceptance, transition and training problems. In comparison, today’s problems are insignificant.
I would suggest to release more often, establish a regular rhythm of changes. Have each release contain fewer changes, changes that appear shortly after the users ask for them and they’re fresh in their mind. Get a regular rhythm going on the “drum“, increase the “takt time”, level the load to reduce the waste due to unevenness.
Making change routine
People don’t like to change. They like routine and predictability. How can we make change easier? Regular “Kaizen” events, regular retrospectives to steer the process establish a rhythm of change. If you review and improve your process each month, every month, people become accustomed to the change.
If you want to change the routine, make change routine
The project burn up/down chart
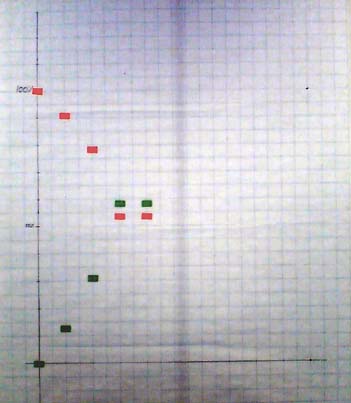
Our team has a very public burn up/down chart. This is where we stand today.
 A short reminder: A short reminder:
- The red line tracks the burndown of estimated story work to do
- The green line tracks the delivery of estimated story value
What happened in the past two weeks?
Two weeks ago, both graphs went sharply up/down. The value chart a bit steeper than the cost chart, because we work on the highest value stories in the beginning of the project
Last week the chart was flat. No story completed this week. Oooops….
Why?
- One story counted two weeks ago turned out to be incomplete. Added some more tests to make the problem apparent, completed the implementation. No extra points, as they were already counted. If we hadn’t completed the story before the end of the week, we would have subtracted the effort and value.
- We’re all working on big, 4-5 point stories. When these complete we’ll have another big jump on the chart. That’s another disadvantage of big stories, they don’t help us level the load and they make tracking less smooth. Maybe we’re in trouble, but we won’t see quickly. We’ll only know next week, when these stories are expected to finish.
- Some of our users seem to be unclear on what new features are available and how to use them, so we spent some time explaining how the application works.
Lessons learned:
- Spend more time on tests, especially acceptance tests
- How could we have broken down these stories in 2-3 point parts?
- User acceptance of new features could become a bottleneck. Read more….
Big VISIBLE chart
People passing by and looking at the chart came up to me and asked “Hey, what’s wrong? Your graph is flat.“. Now that is instant visibility into the state of the project. Passers-by know at a glance when we’re doing well or badly.
Not bad for a tool that cost almost nothing and takes 10 minutes a week to update…
|
 I’m again organizing XP Day Benelux with Vera, Marc and Rob. This year we’re back in the Netherlands, in Rotterdam.
 I’ll be going to the German XP Days on November 21st in Karlsruhe. My boss (me 🙂 won’t let me go to such conferences unless I present a session, so that’s what I’ll be doing. I’ll be hosting a session on The Toyota Way, similar to the session I hosted at the XP2005 conference in Sheffield this year.
 And I’m also going to XP Day London on November 28th and 29th. The London XP Day inspired us to do something like that ourselves. I will be hosting the I’m not a bottleneck! I’m a free man! with Rob Westgeest.


 A short reminder: